Stay Informed: Track Radiation Levels with the National Radiation Map

Make sure to like Living Green and Frugally on Facebook, Shop at Amazon to help support my site and explore our PINTEREST BOARDS for innovative ways you can become self-sufficient.
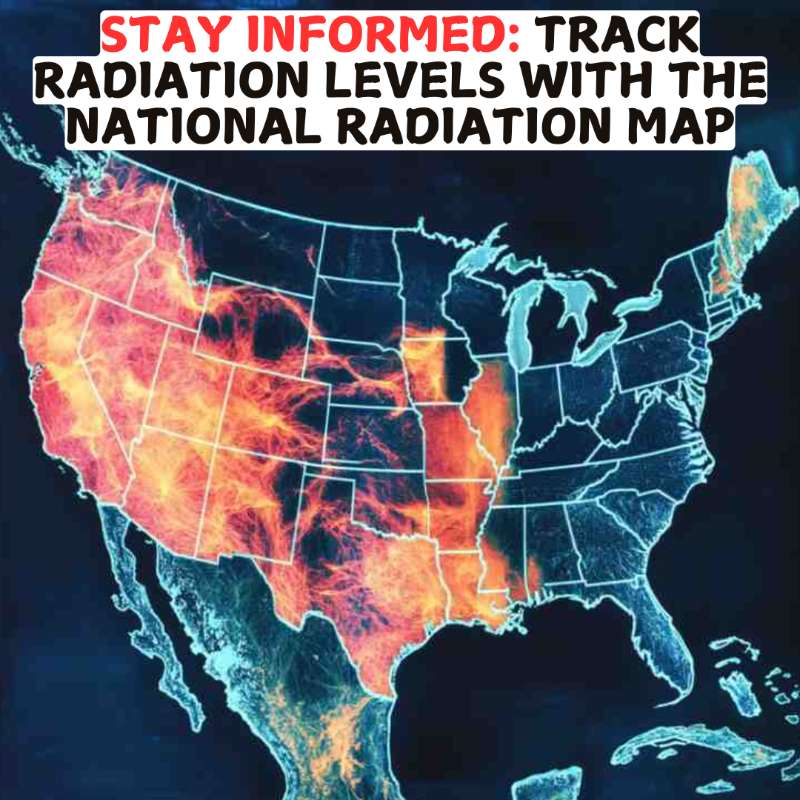
In a world increasingly concerned about environmental safety, understanding radiation levels is more important than ever. The National Radiation Map, hosted by RadiationNetwork.com, serves as a crucial tool for monitoring environmental radiation across the United States. This innovative platform provides real-time updates, allowing anyone to check radiation levels at any time, from anywhere.
Welcome to the National Radiation Map
RadiationNetwork.com is home to the National Radiation Map, the first web-based resource where citizens can view real-time radiation levels across the U.S. This unique project empowers individuals by giving them access to essential information about their environment. With the map updating every minute, users can remain informed about radiation levels, helping them make educated decisions regarding their health and safety.
Understanding the Map
The National Radiation Map operates through a growing network of Radiation Monitoring Stations equipped with various models of Geiger counters. These stations continuously upload radiation data to the website via a data cable and the automated GeigerGraph for Networks software. This system means that users can access up-to-the-minute radiation counts, often updated every minute without any manual intervention.
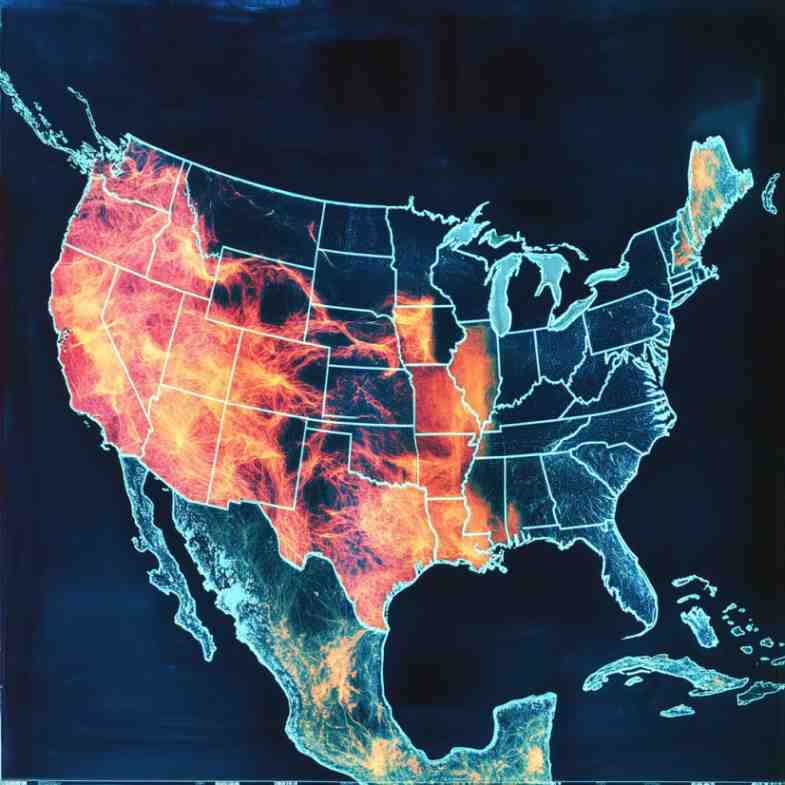
On the map, users will find color-coded indicators representing different radiation levels measured in Counts Per Minute (CPM). The legend at the bottom left corner of the map provides key information on how to interpret the readings. Normal background radiation typically ranges from 5 to 60 CPM, while levels exceeding 100 CPM can indicate the presence of additional radioactive sources.

Why Monitor Radiation Levels?
Understanding radiation levels is vital for several reasons:
- Health and Safety: Awareness of radiation exposure helps individuals and communities make informed choices about their health, especially for those living near nuclear sites or areas with a history of radiation incidents.
- Environmental Awareness: Monitoring radiation levels contributes to a better understanding of environmental health, helping to identify potential sources of radiation that may affect local ecosystems.
- Emergency Preparedness: In the event of a nuclear incident, having real-time data can aid in quick decision-making and effective response measures to protect public health.
How to Read the Radiation Map
To make the most of the National Radiation Map, familiarize yourself with its features:
- Monitoring Stations: Locate various stations across the country that provide radiation data. Click on the stations to see live updates of their CPM readings.
- Alert Levels: Be aware of the alert levels indicated on the map. An alert is triggered if a monitoring station records three consecutive minutes of readings at or above 100 CPM or 2.5 times the station’s baseline.
- Time and Date Stamp: Check the time and date stamp at the bottom center of the map to verify how recently the radiation levels have been updated.
Getting Involved: Join the Radiation Monitoring Effort
If you’re interested in becoming part of this grassroots initiative, you can join the network by utilizing compatible Geiger counter models and the GeigerGraph software. Here’s what you need to get started:
- A compatible Geiger counter (a list of models is available on RadiationNetwork.com)
- GeigerGraph software and a data cable
- A computer with a Windows operating system
- Internet access for data transmission
By participating, you’ll contribute to a vital community effort while gaining access to an interactive map that enhances your monitoring experience with additional layers of information, such as roads, rivers, and nuclear sites.

Common Questions and Answers
Q: What do CPM readings mean?
A: CPM stands for Counts Per Minute. It measures the number of radiation events detected by a Geiger counter in a minute. Higher CPM readings can indicate elevated radiation levels.
Q: What should I do if I see high readings on the map?
A: If you observe readings exceeding normal levels (above 100 CPM), stay informed through local news and health agencies for any necessary safety measures.
Q: Are the radiation readings accurate?
A: While the data is provided in real time, the accuracy of readings can vary due to Geiger counter malfunctions or external factors. Always consider additional context and local advisories.
Q: How can I contribute to the network?
A: Interested individuals can join the nationwide network by setting up a compatible Geiger counter and utilizing the GeigerGraph software, contributing their data to the National Radiation Map.
Conclusion
The National Radiation Map is a groundbreaking initiative that promotes transparency and awareness regarding environmental radiation levels. With real-time updates and a commitment to community participation, RadiationNetwork.com stands at the forefront of public safety in radiation monitoring. By engaging with this resource, individuals can take proactive steps to understand and respond to radiation levels in their environment. Explore the National Radiation Map today and become an informed participant in the ongoing conversation about environmental health and safety.
